Guide contents
Market share
Who is gaining and losing share in a category.
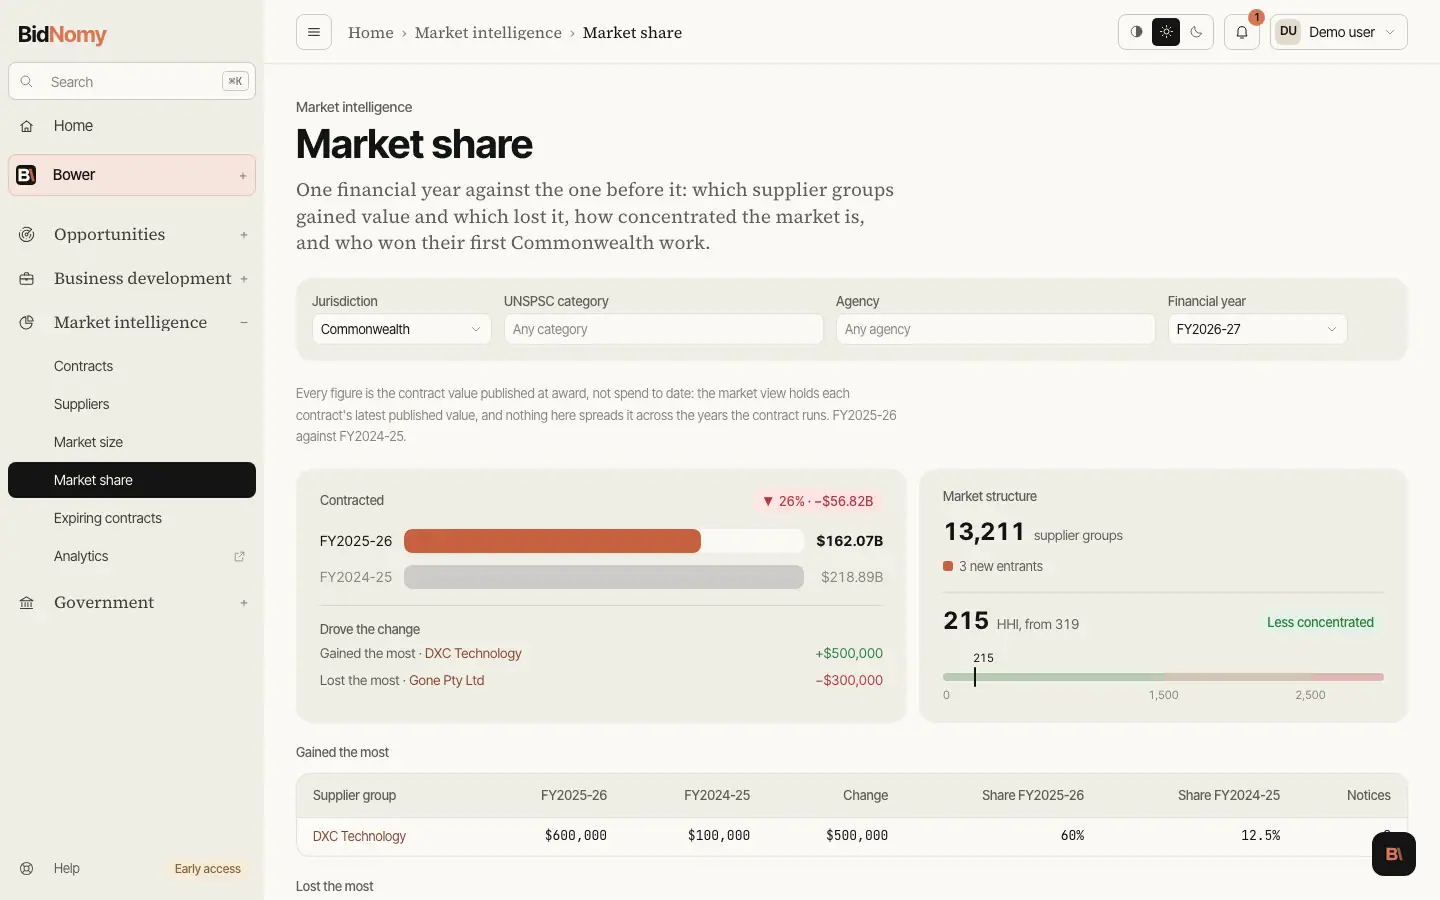
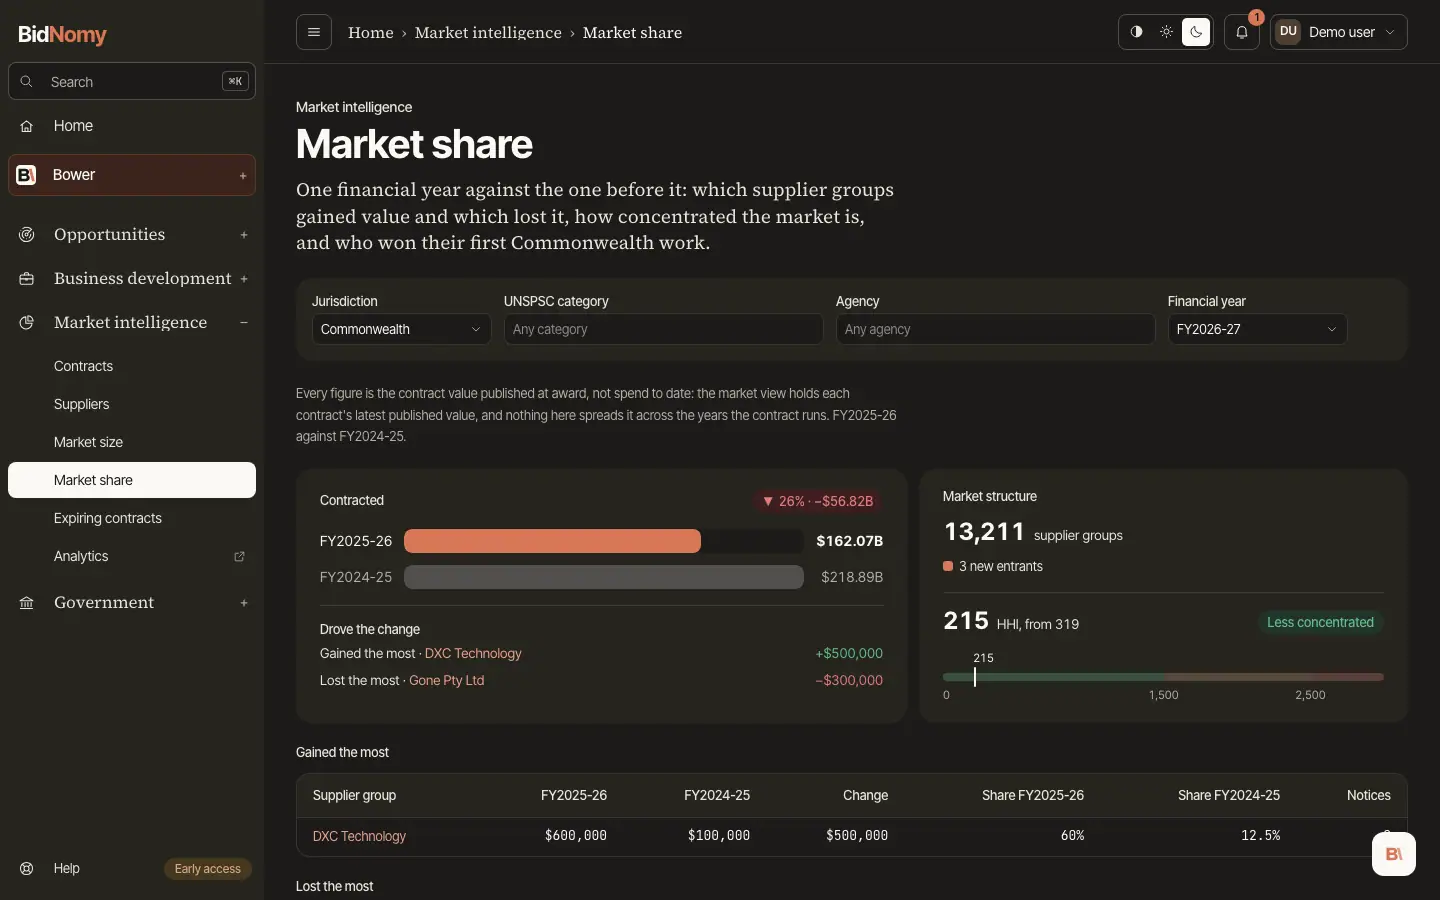
Market share
One financial year against the one before it, in the same scope.
- Contracted — the left panel: one bar for each year, with the change in per cent and in dollars at the top right. Under it, Drove the change names the group that gained the most and the group that lost the most (the first row of each list below) and how far each moved. A line with no group behind it is left out.
- Market structure — the right panel: how many supplier groups won work this year and how many new entrants there were. For a state or all jurisdictions the entrants are part of that count, so one bar splits it into returning and new. For the Commonwealth they are not (a supplier group needs a published ABN and an entrant does not), so the new entrants are shown as their own number.
- HHI — under the supplier count: this year's HHI, last year's beside it, and whether the market became more or less concentrated. HHI is the sum of every group's squared percentage share. The gauge runs from 0 to 3,000 in three bands: under 1,500 is open, 1,500 to 2,500 moderate, over 2,500 concentrated. A jump between the two years is a market closing up.
- Gained the most / Lost the most — the fifteen groups whose value moved furthest in each direction, with both years, both shares and the change in dollars. The losers list includes groups that held work last year and none this year.
- New entrants — groups whose first Commonwealth contract in any category falls in this year. A prime that has sold since 2009 and has just taken its first job in your segment is a competitor moving in, not a new company, so it is not counted here.